Report Published July 20, 2026 · 11 minute read
The State of Hispanic Business
Benjamin Weiser & Imani Augustus

If Latinos in America were their own national economy, they would rank as the fourth-largest economy in the world—surpassing countries such as the United Kingdom, Japan, and India.1 Yet the defining feature of Hispanic entrepreneurship is a paradox: more businesses, not bigger businesses.
Hispanic Americans have long contributed to the nation's prosperity, building businesses, creating jobs, and strengthening communities across the country while overcoming barriers to economic mobility, including those around access to capital and business ownership. Their importance to the nation’s future cannot be overstated: in addition to the size of the Latino economy in the United States, Hispanics could represent one-quarter of the US population by 2060.2
This growth is unfolding against a backdrop of real economic and social pressure. Rising costs of living, housing, and childcare are straining Hispanic households while debates over immigration policy and enforcement are reshaping daily life for many mixed-status families and communities. These dynamics don't just affect individuals—they ripple into the businesses Hispanic entrepreneurs build, the workers they employ, and the financing they can access. In this climate, business ownership stands out as one of the most durable paths to economic security: a way for families to build equity, create generational wealth, and gain a measure of stability even amid broader uncertainty. Understanding where Hispanic entrepreneurs face the steepest barriers—and where the greatest opportunities lie—is essential to ensuring this path remains open and expanding.
In this report, we provide a detailed portrait of Hispanic entrepreneurship to help policymakers advance evidence-based strategies that support business growth, economic mobility, and long-term prosperity.
As detailed in this report, we find that Hispanic-owned businesses are:
- Growing Rapidly: Hispanic-owned businesses account for a disproportionate share of new businesses in the United States.
- Growing in Number, Not Size: Hispanic-owned businesses are increasing in number faster than in size, resulting in smaller average firms by revenue and employment.
- Expanding Beyond Traditional Hubs: Hispanic-owned businesses are forming in nearly every state, extending well beyond traditional hubs for Hispanic populations.
- Often Going it Alone: 9-in-10 Hispanic-owned businesses have no employees, a pattern reflecting barriers to growth.
- Young and Diverse: Hispanic entrepreneurs are a younger and more demographically diverse, including many immigrants.
- Distributed Across Industries: Hispanic-owned businesses operate across the economy but are concentrated in a handful of industries, particularly the construction and service sectors.
- Facing a Scaling Gap: Hispanic-owned businesses struggle to grow into companies that employ workers.
- Capital Constrained: 1-in-3 Hispanic-owned businesses that sought financing were denied, showing they are more likely to encounter financing challenges that limit growth and expansion opportunities.
- Adopting New Technologies: Hispanic-owned businesses are increasingly leveraging technology and AI to compete in emerging and high-growth sectors.
- Seeing the Export Advantage: 2.1% of Hispanic-owned employer firms are exporters, but they account for 16% of all revenues generated by Hispanic-owned firms.
The Growth Paradox
Finding 1: Growing Rapidly
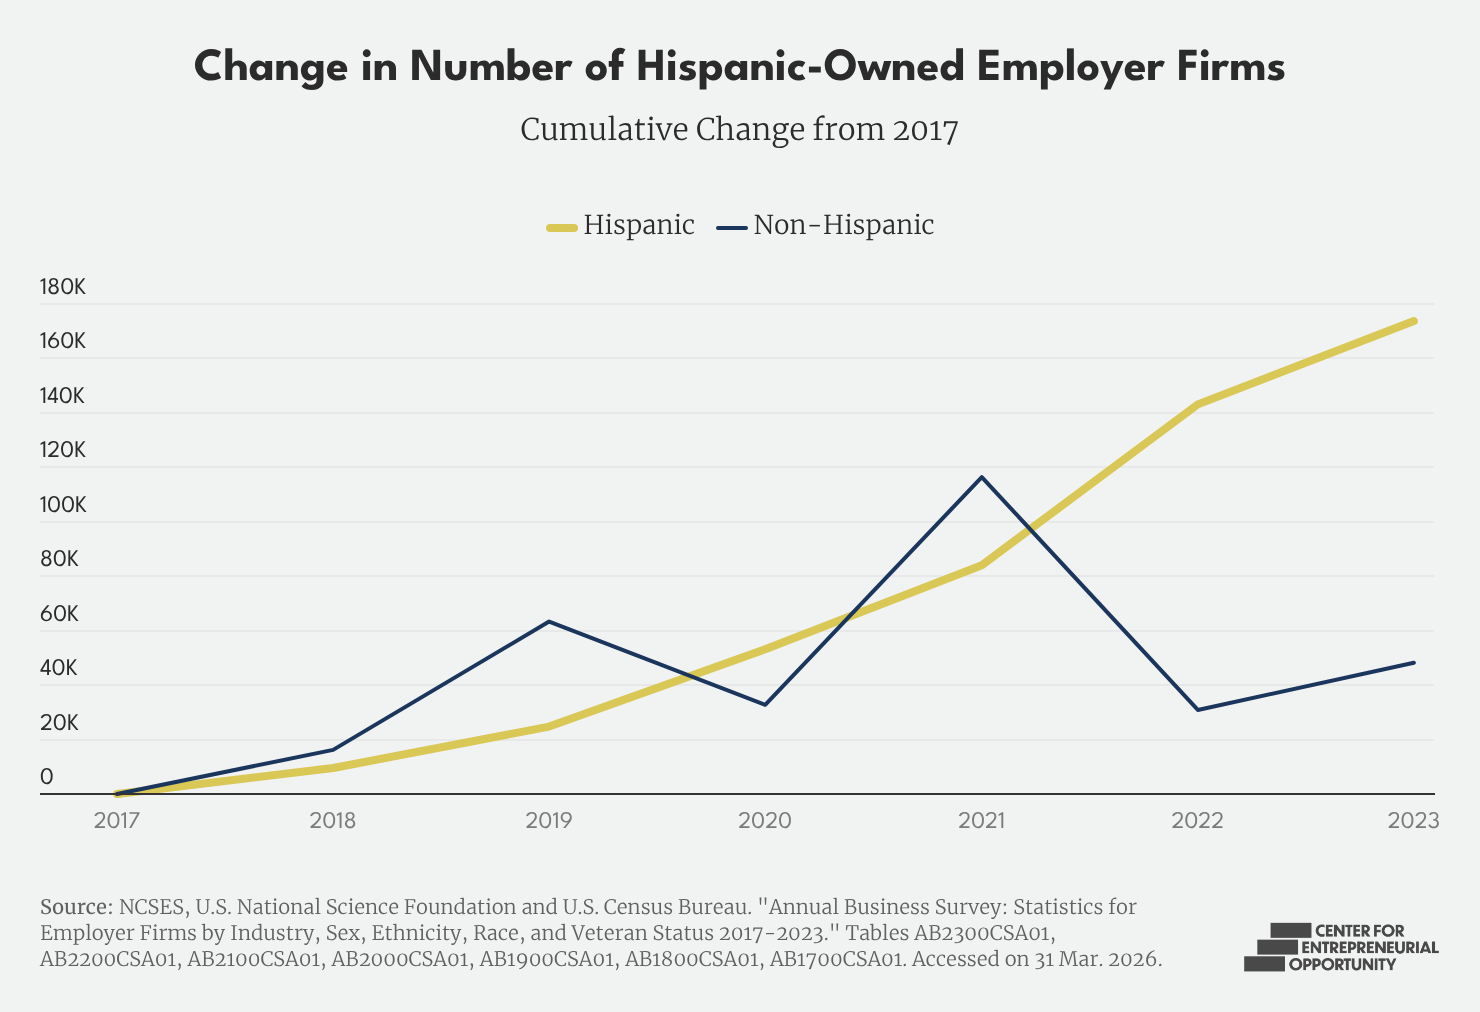
The Hispanic community has been a driving force for entrepreneurship in America. From 2017 to 2023, Hispanic entrepreneurs created over 173,000 new employer firms, a 54% increase, while non-Hispanic entrepreneurs added just over 48,000.3 One-third of new Hispanic-owned employer firms are women-owned.4
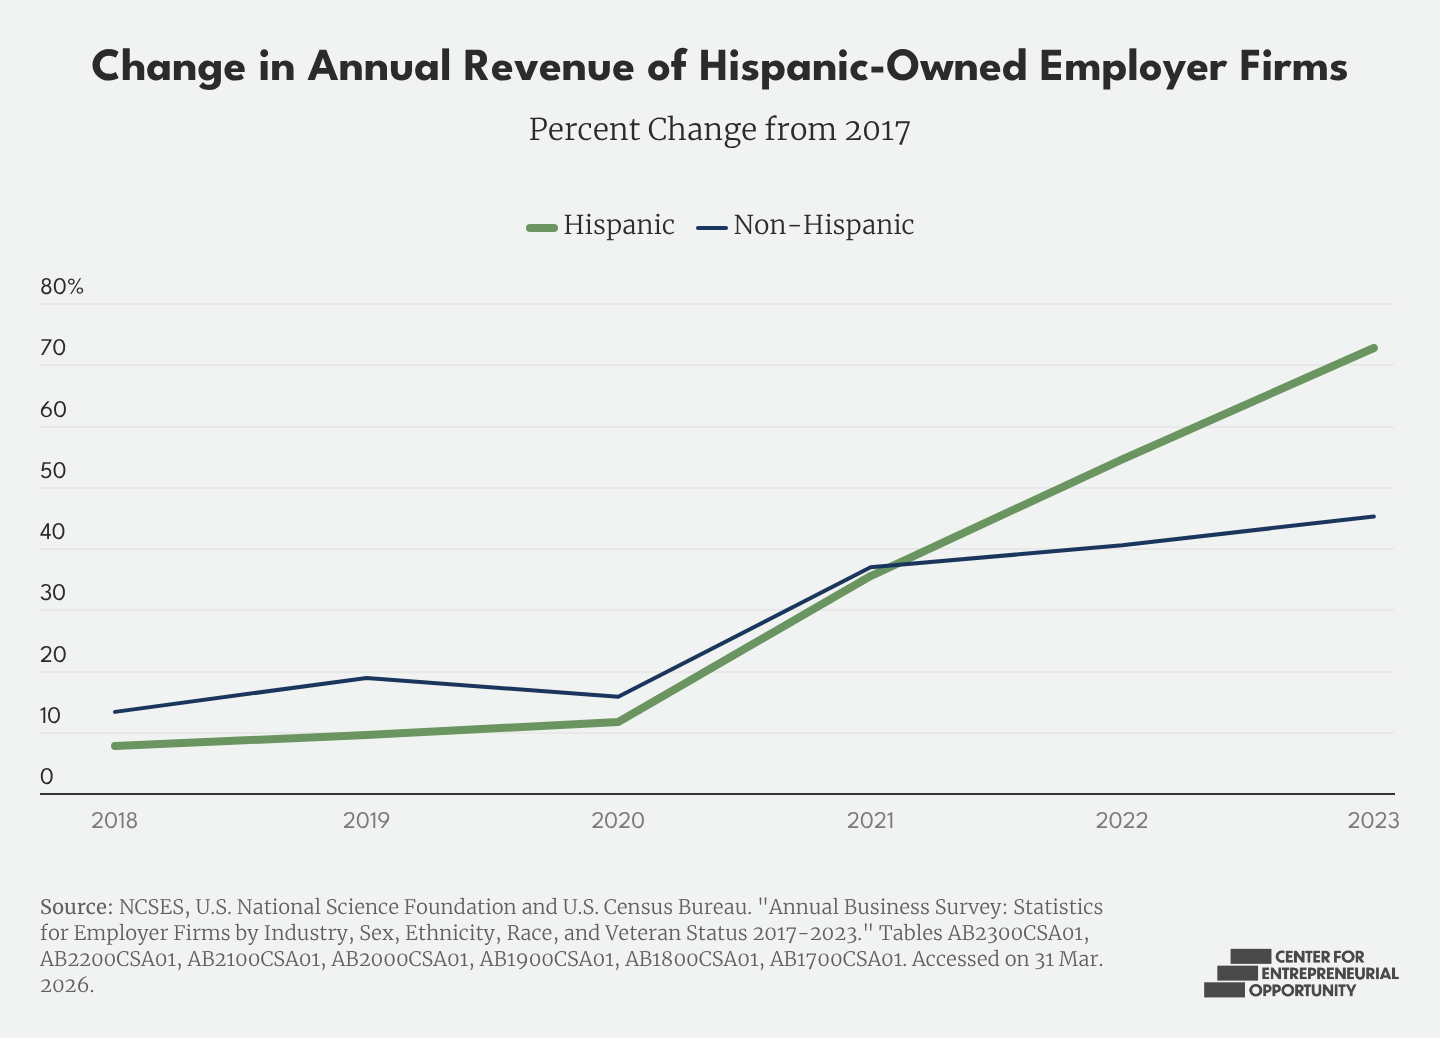
During the pandemic, while many struggled to keep their doors open, Hispanic-owned businesses continued to grow in number. With that came a growth in total revenue generated by Hispanic-owned businesses—from 2020 through 2023 (most recent available data), the annual change in revenue generated by Hispanic-owned firms outpaced that of non-Hispanic firms.5 Hispanic women-owned employer businesses nearly doubled their revenue, outpacing Hispanic male-owned businesses.6
Finding 2: Growing in Number, Not Size
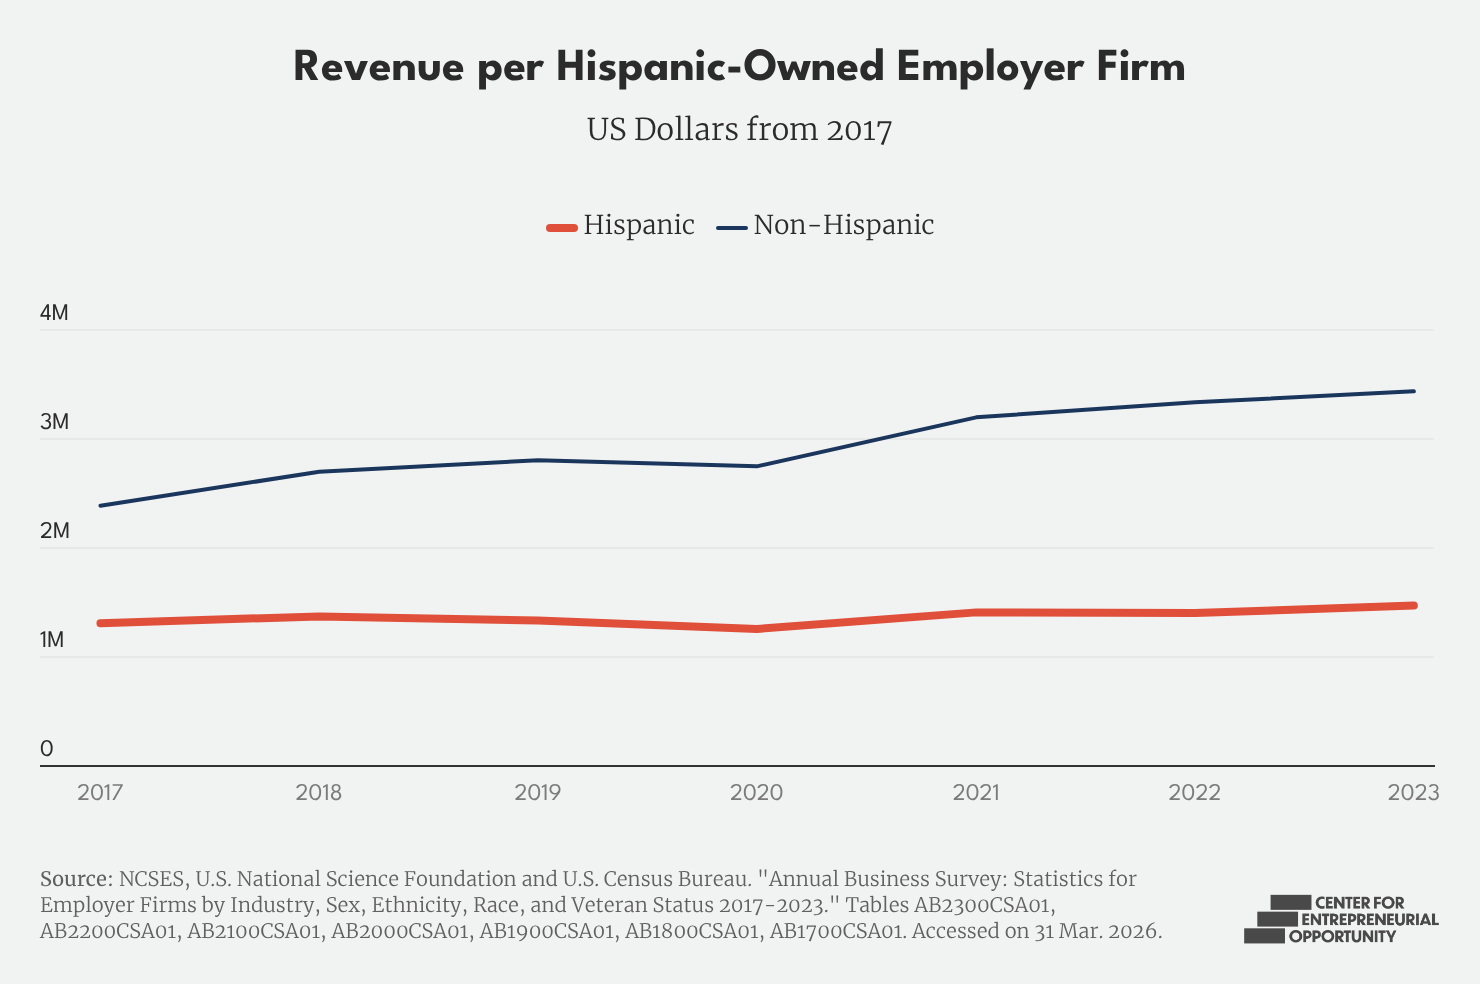
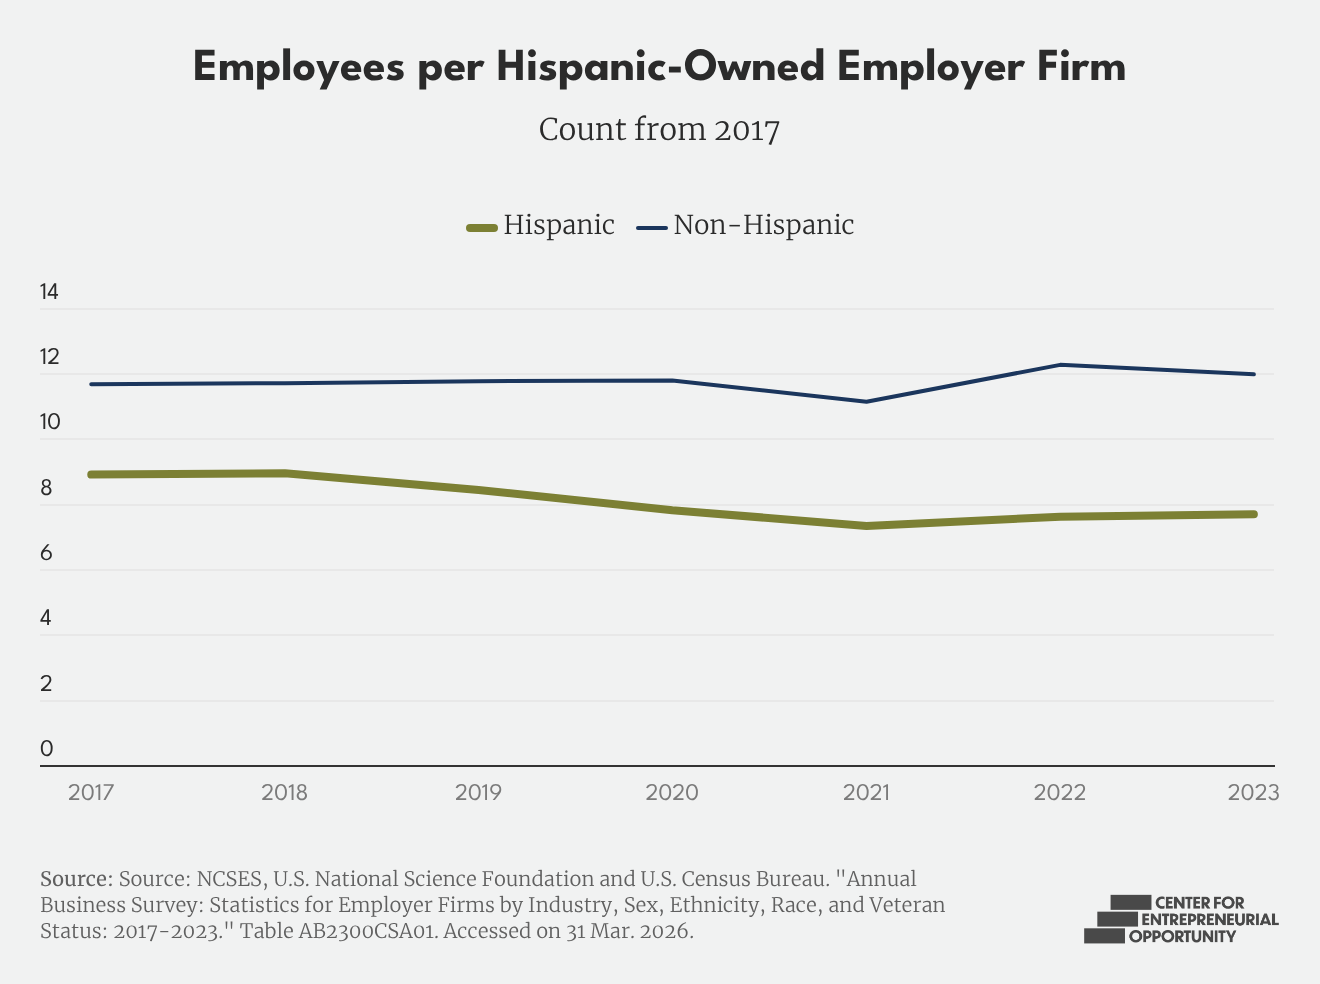
The growth of Hispanic-owned businesses has been driven more by business formation than scaling. In other words, while there are more Hispanic-owned businesses today, the typical firm is not substantially larger than it was previously.
Hispanic-owned firms remain smaller than non-Hispanic-owned firms by both employment and revenue measures, and those differences have persisted over time. Hispanic-owned employer firms employ fewer workers per firm and generate less revenue per firm than their non-Hispanic counterparts, despite rapid growth in the number of businesses.7 As in many communities, business owners have varied motivations for starting a company. Not all entrepreneurs aim to grow multi-employee ventures; some simply seek to earn a living and support their families. The data does not capture these motivations or explain individual behavior.
Finding 3: Expanding Beyond Traditional Hubs
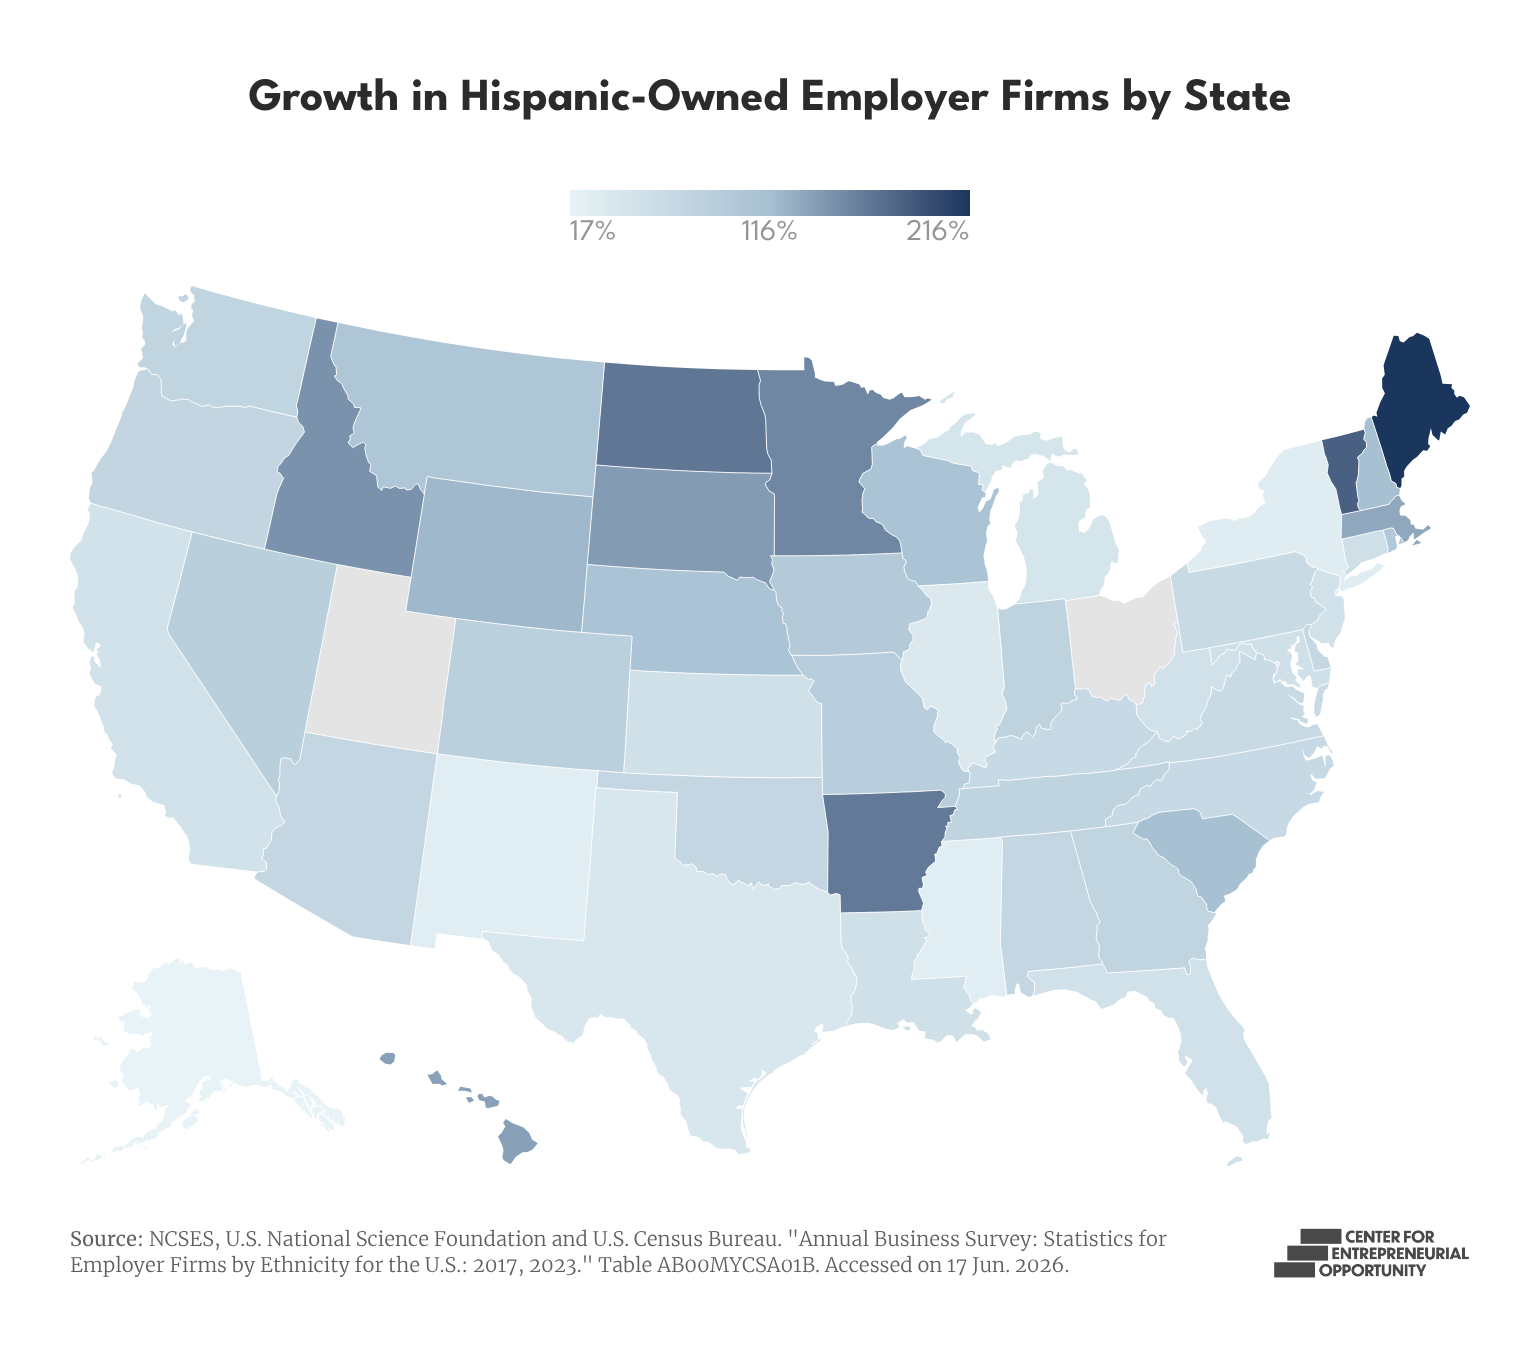
Hispanic business growth is not limited to traditional hubs like California, Texas, Florida, and New York. From 2017 to 2023, the number of Hispanic-owned businesses increased in 48 of 50 states.
States with relatively small Hispanic business communities—including Minnesota, Arkansas, Massachusetts, North Dakota, Maine, and Wyoming—experienced notable growth during this period.8 The geographic distribution across states presents new opportunities for business development and investments in Hispanic entrepreneurship.
Finding 4: Often Going It Alone
Hispanic entrepreneurs are more likely to start and operate a business without employees, with 91.5% of Hispanic entrepreneurs doing so compared to 82.5% of non-Hispanic entrepreneurs.9
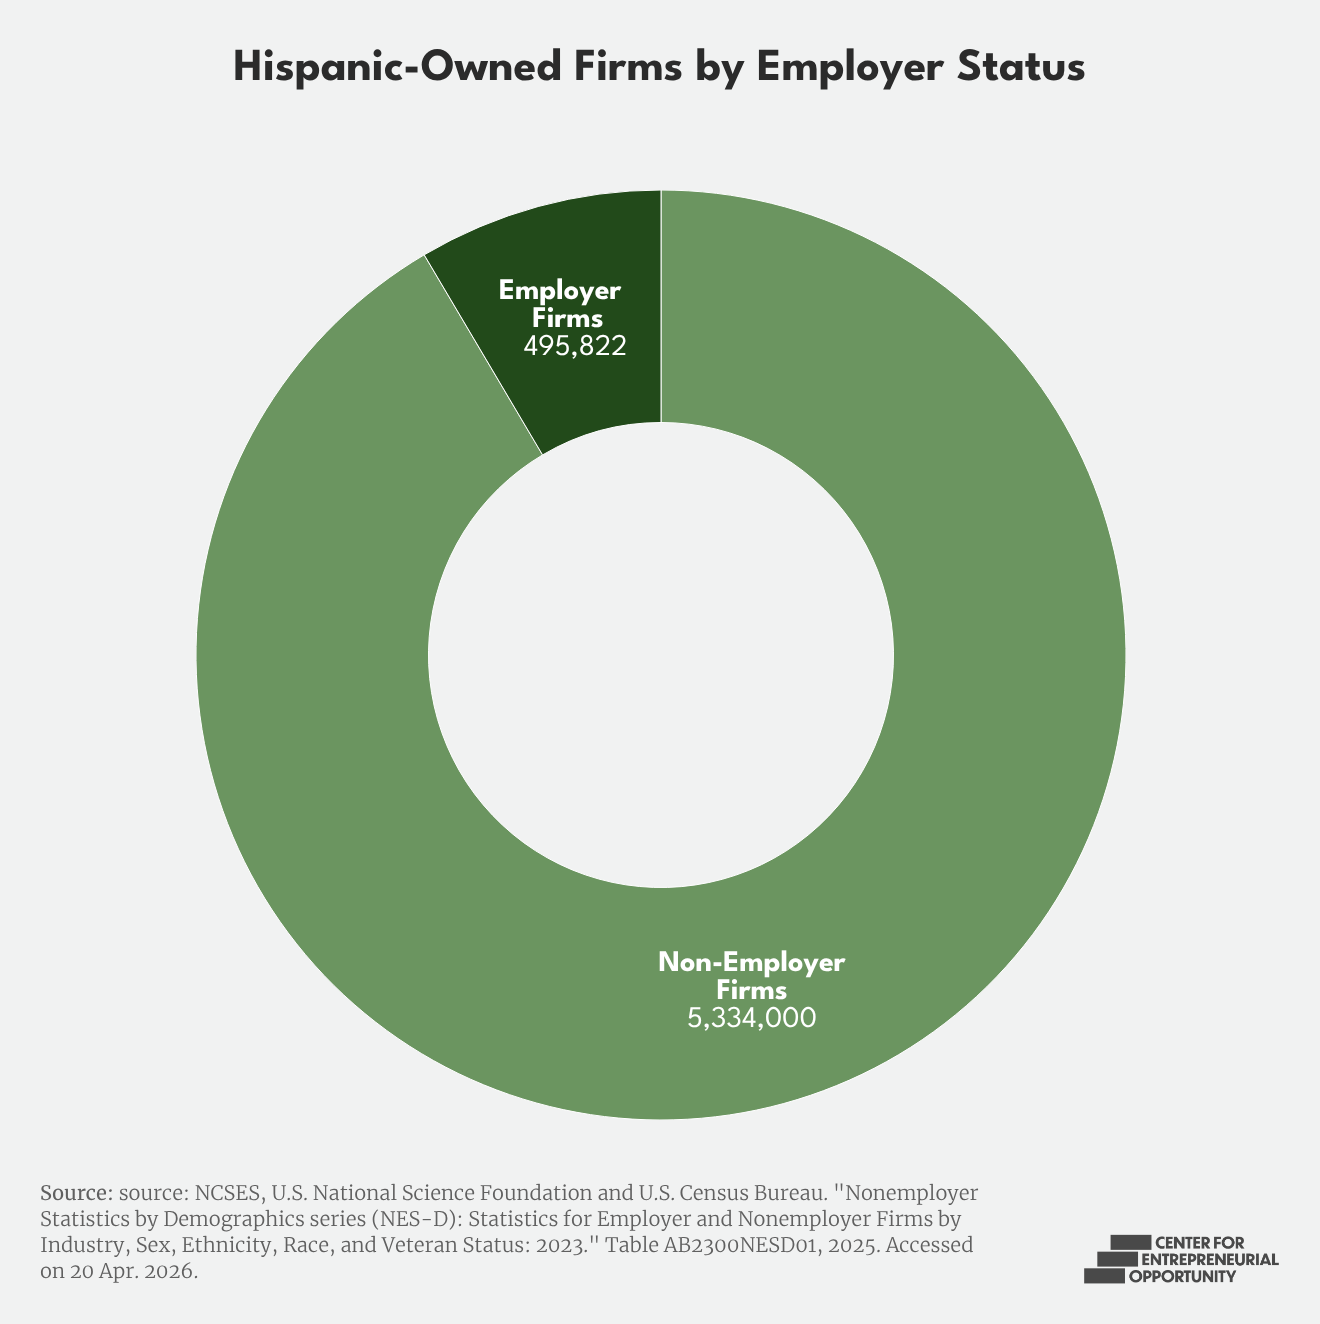
Non-employer firms—businesses without paid employees, such as sole proprietorships and independent contractors—are often the first step in entrepreneurship. The concentration of Hispanic-owned businesses among non-employer firms suggests that while business formation is strong, growth into employer firms remains a challenge.
Who is Starting Businesses?
Finding 5: Young and Diverse
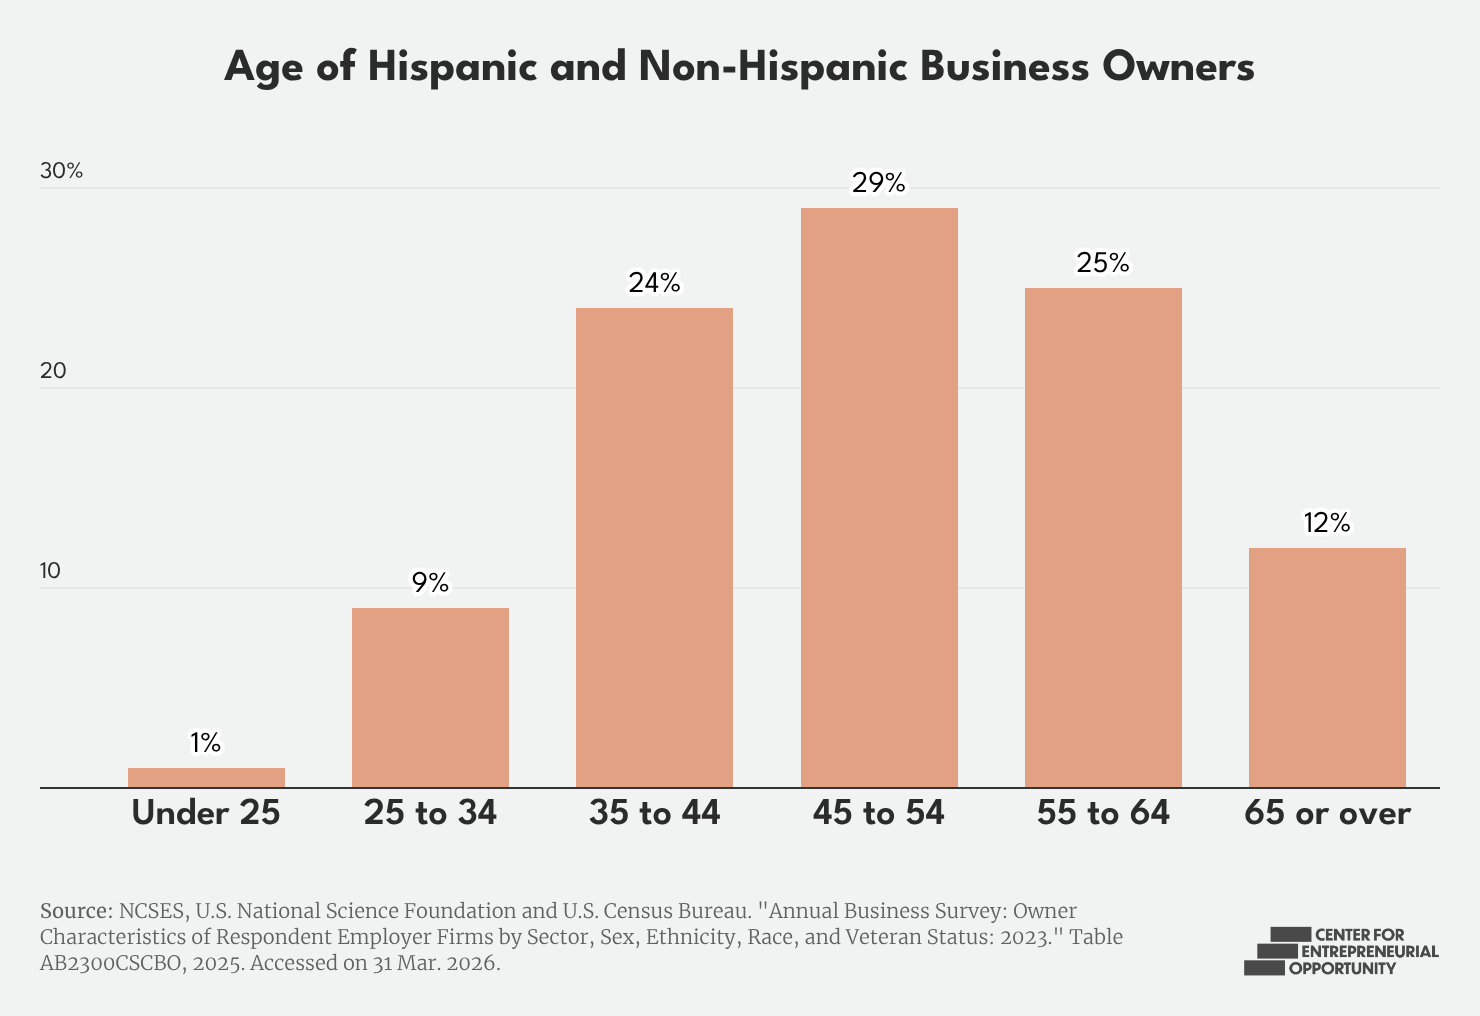
Hispanic business owners are significantly younger than their non-Hispanic counterparts. Nearly 63% are under the age of 55, compared to less than half of non-Hispanic business owners.10 Meanwhile, only 12% of Hispanic business owners are age 65 or older, compared to approximately 24% of non-Hispanic business owners.11 As millions of business owners approach retirement, younger Hispanic entrepreneurs can play a critical role in supporting business continuity and economic dynamism.
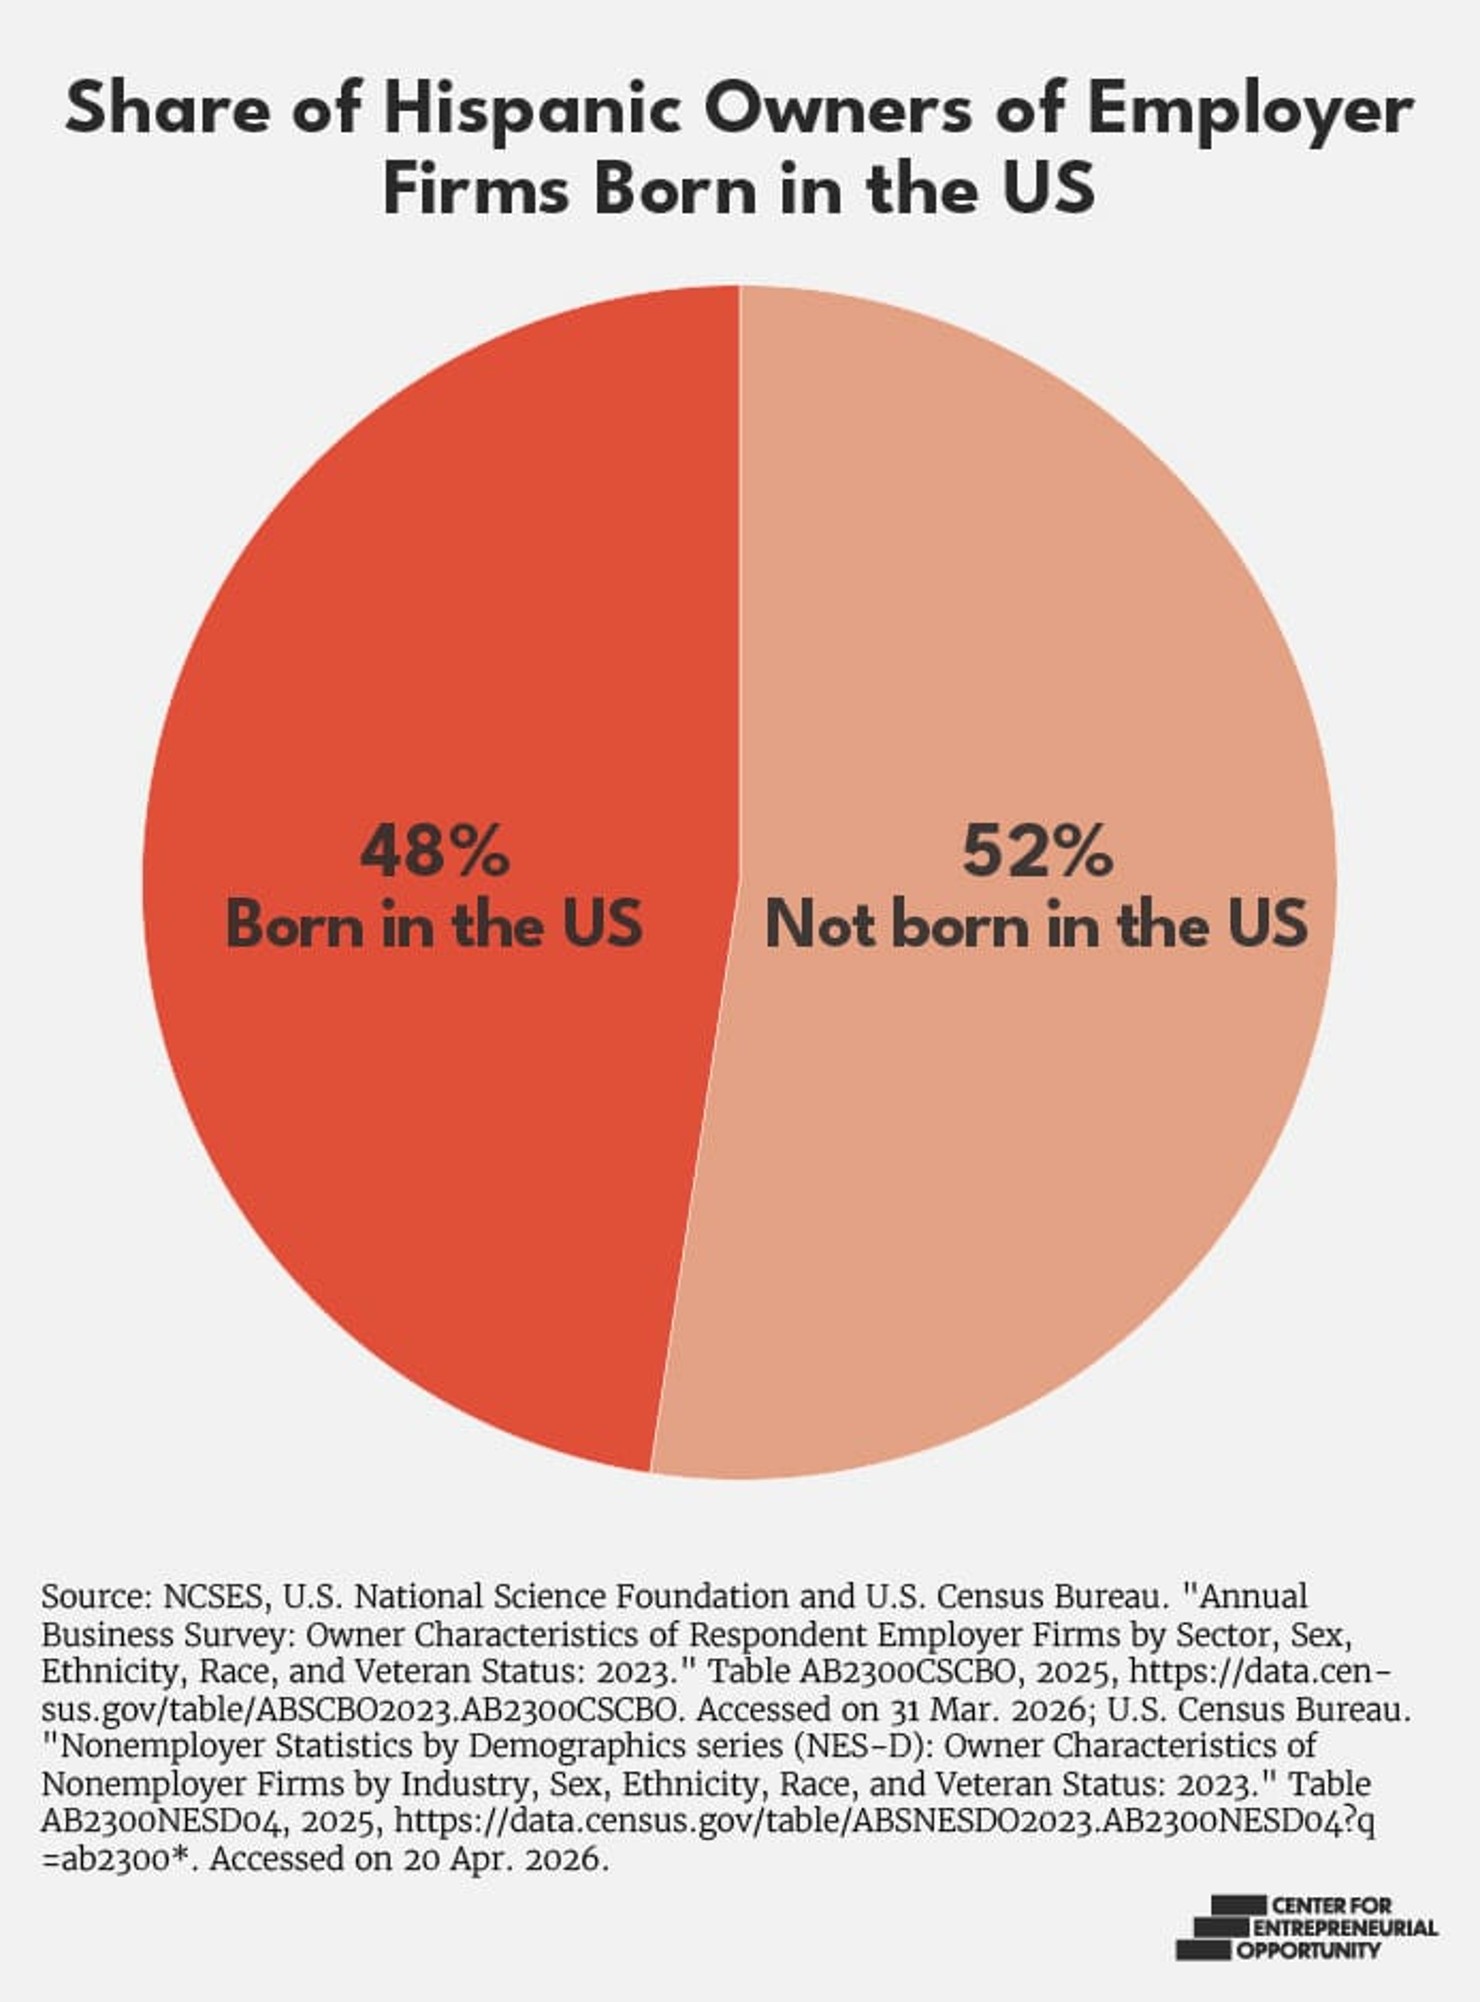
More than half of Hispanic business owners were born outside the United States. Overall, 52.4% are foreign-born—roughly three times the rate among non-Hispanic business owners.12 Among owners of non-employer firms, that figure rises to 57.4%.13
Hispanic entrepreneurs have a diverse range of educational backgrounds as well. Nearly one-third start businesses without attending college, while more than half of non-Hispanic business owners have earned a bachelor’s degree or higher, highlighting the different pathways into business ownership.14
Educational attainment may help explain some of the industry and scaling patterns observed throughout this report, particularly in sectors where professional credentials are common.
Industry Distribution
Finding 6: Distributed Across Industries
Although, Hispanic-owned businesses operate across numerous industries, there is notable concentration. Four industries—administrative and support services; professional, scientific, and technical services; accommodation and food services; and construction—account for roughly half of all Hispanic-owned employer businesses.
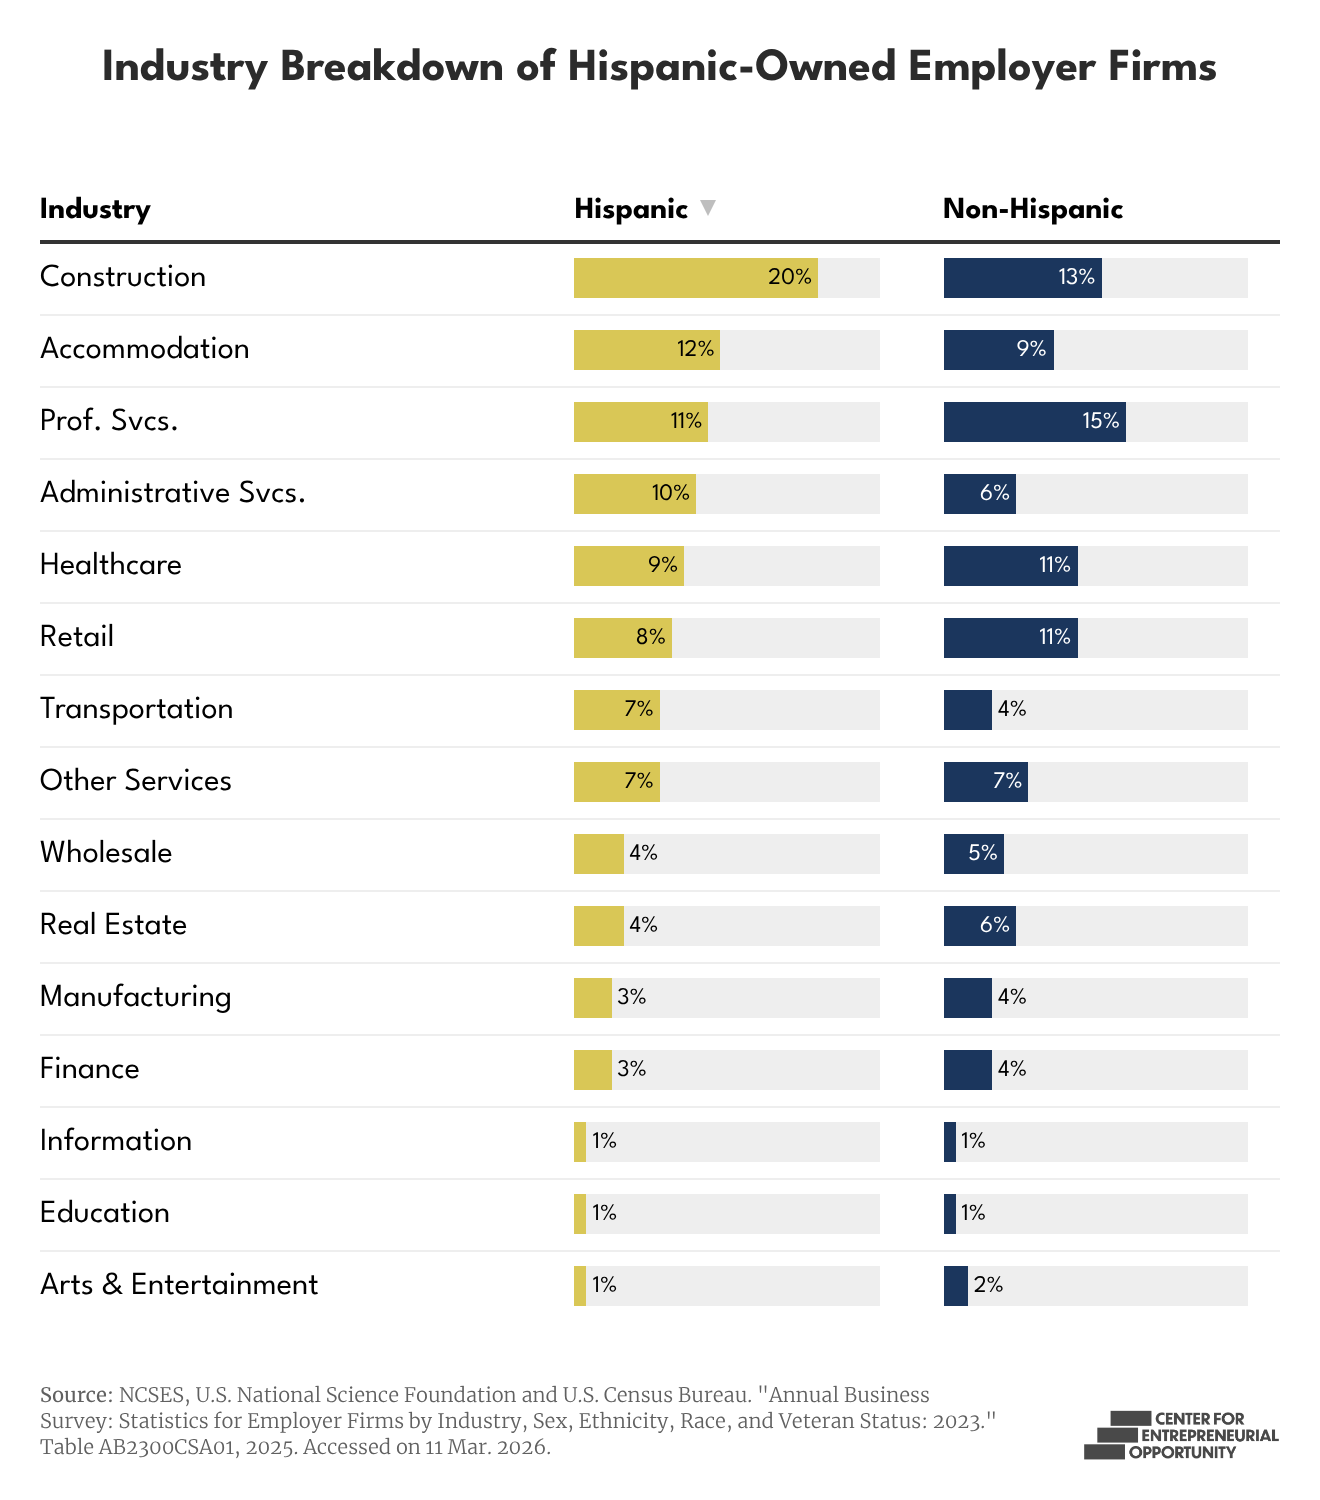
Compared to non-Hispanic-owned firms, Hispanic businesses are likelier to enter construction; transportation and warehousing; and administrative and support services, while being less present in professional and financial services. These concentrations matter because industries differ significantly in their barriers to entry and opportunities for growth.
Finding 7: Facing a Scaling Gap
The growth of Hispanic entrepreneurship reveals an important distinction: starting and scaling a business are not the same thing.
To better understand where Hispanic-owned businesses appear more likely to grow into employer firms across industries, we developed the Scaling Gap.15 The metric compares Hispanic business representation among employer and non-employer firms within each industry. Positive values indicate that Hispanic-owned businesses are relatively more likely to transition into employer firms, while negative values indicate they are more likely to remain non-employers.
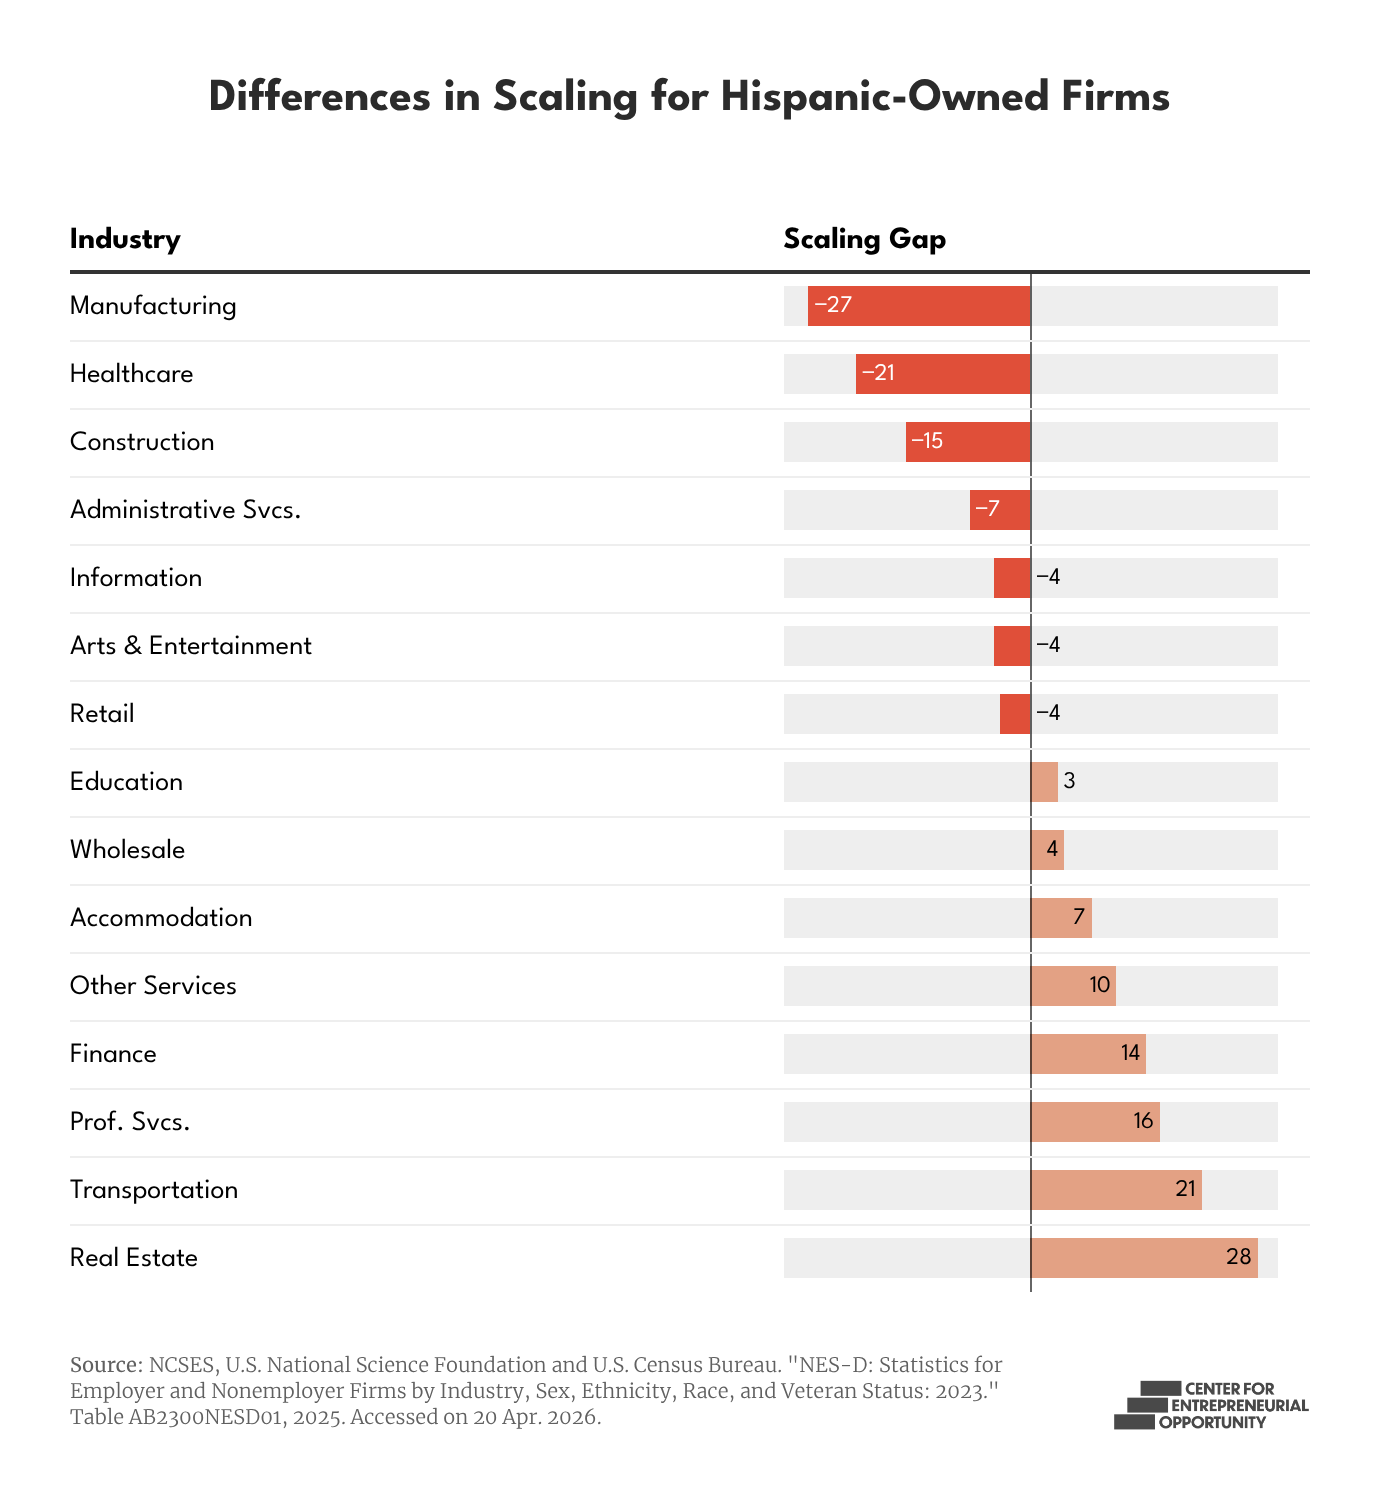
The transportation and warehousing industry stands out as a notable success story. Hispanic-owned businesses are heavily represented in the industry and show stronger evidence of scaling than in other industries. Hispanic entrepreneurs are not only entering the industry at high rates—they are also building businesses that hire workers, demonstrating that strong participation and strong scaling can occur simultaneously.
While transportation and warehousing stands out as a notable exception, Hispanic-owned businesses tend to fall into one of two categories: strong presence with limited scaling, or limited presence with stronger scaling.
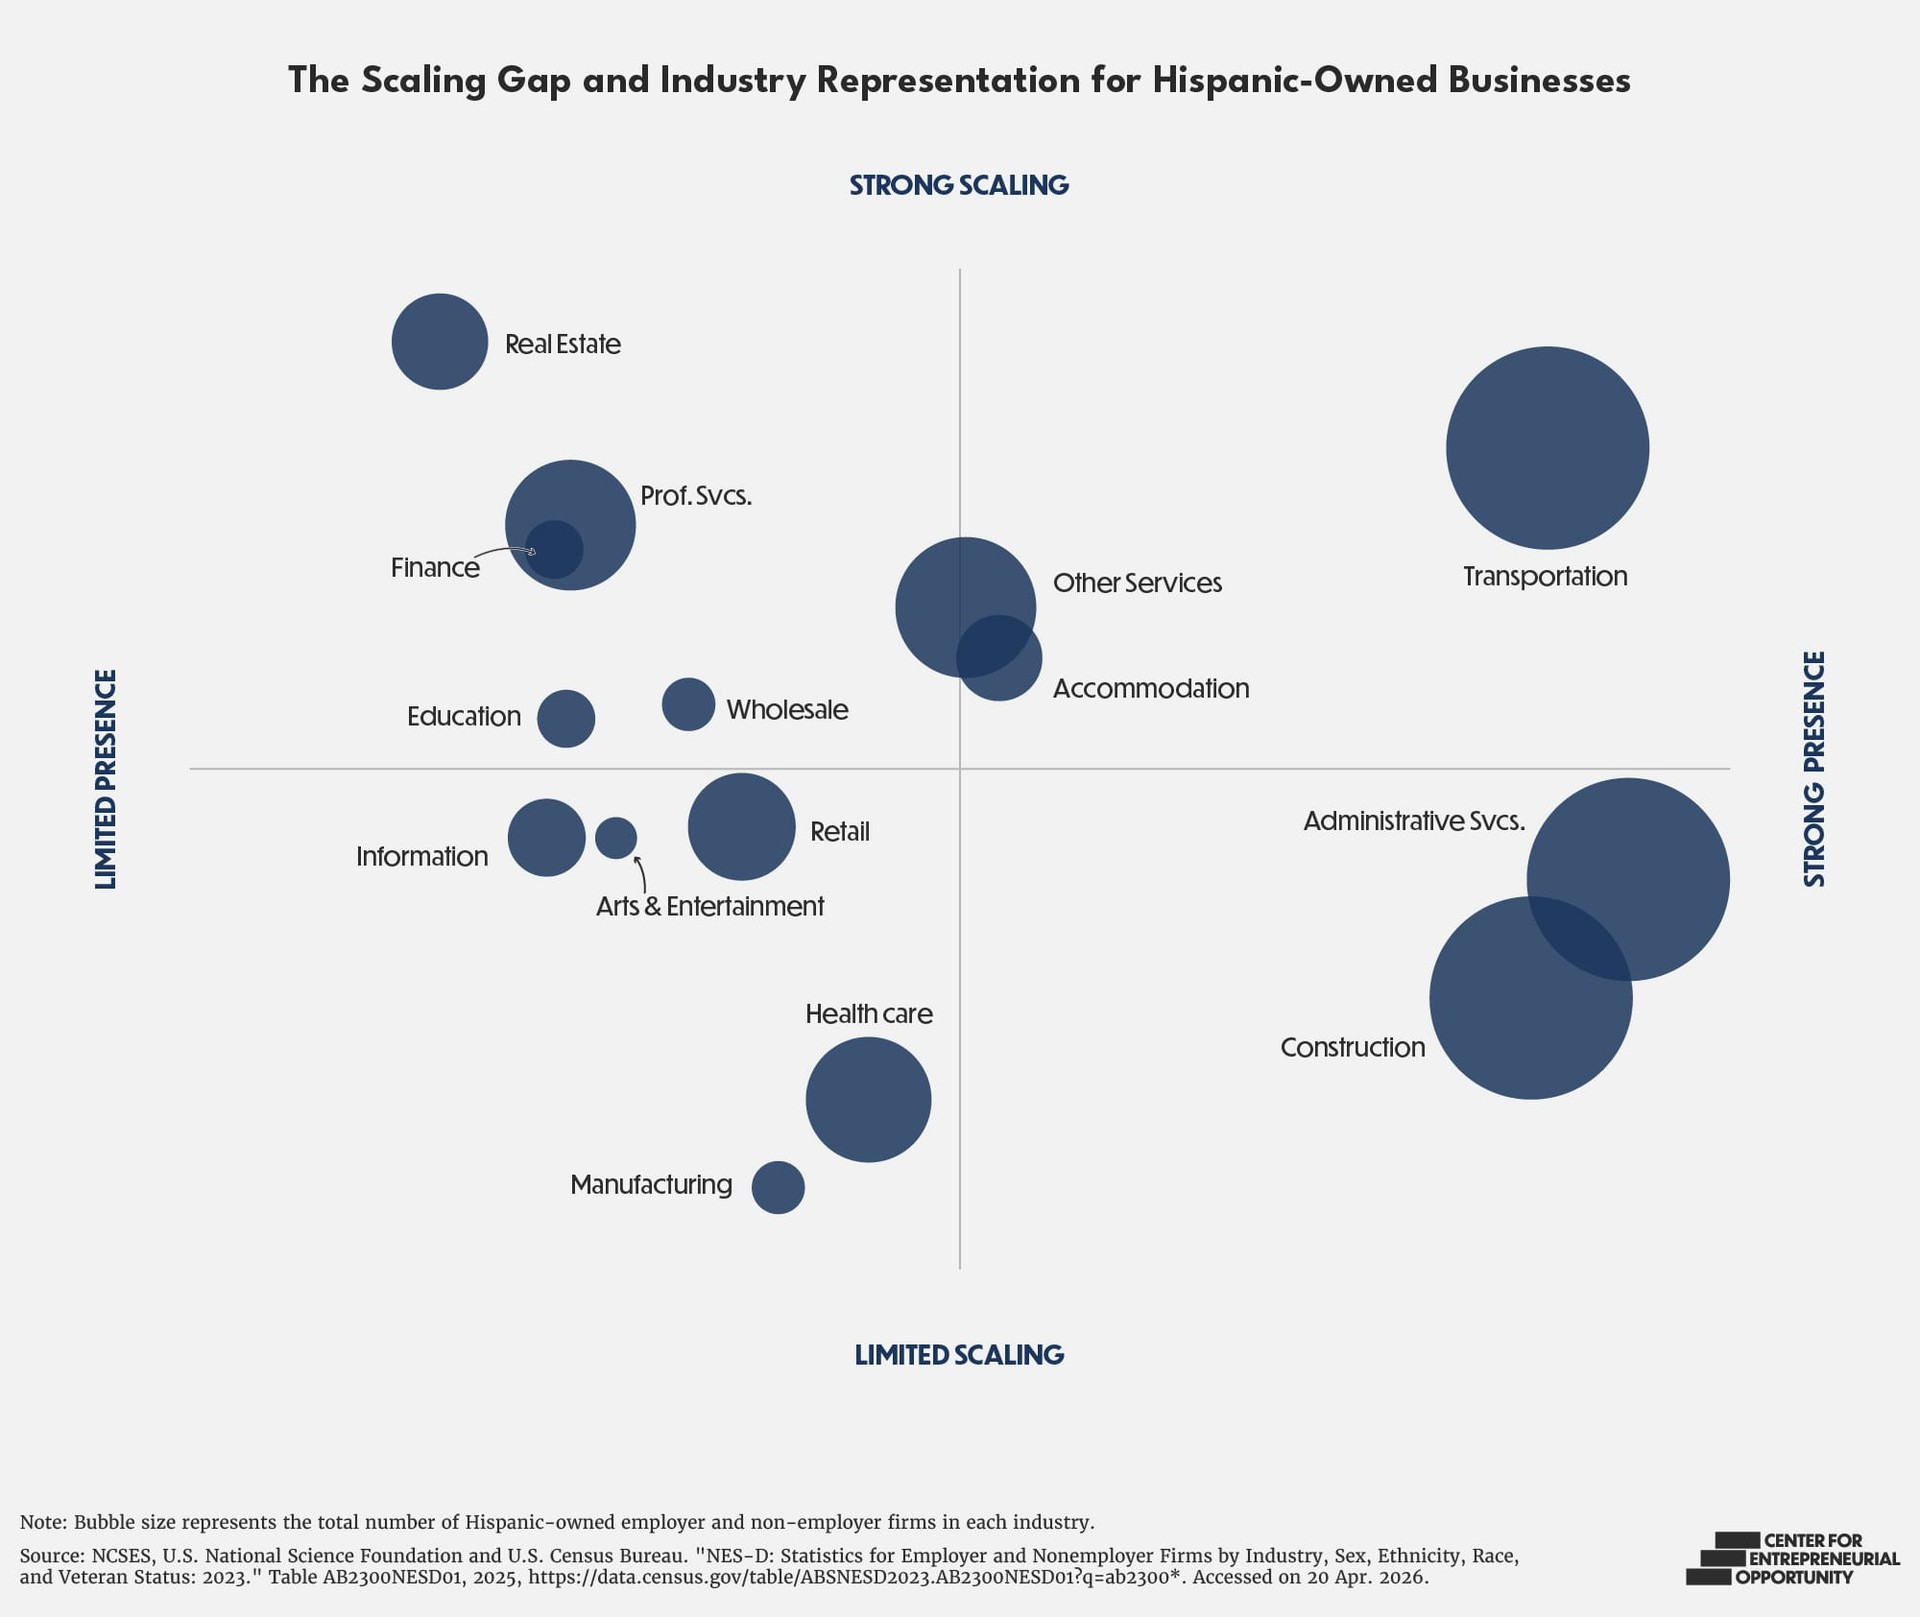
These patterns suggest that Hispanic-owned businesses face different barriers across industries. In sectors where Hispanic entrepreneurs are already participating at high rates, the challenge is often growth and scaling. In sectors where Hispanic-owned businesses remain underrepresented, the challenge is more often barriers to entry (e.g., education or credential requirements). While the barriers differ across industries, access to capital emerges as one of the most consistent challenges.
Finding 8: Capital Constrained
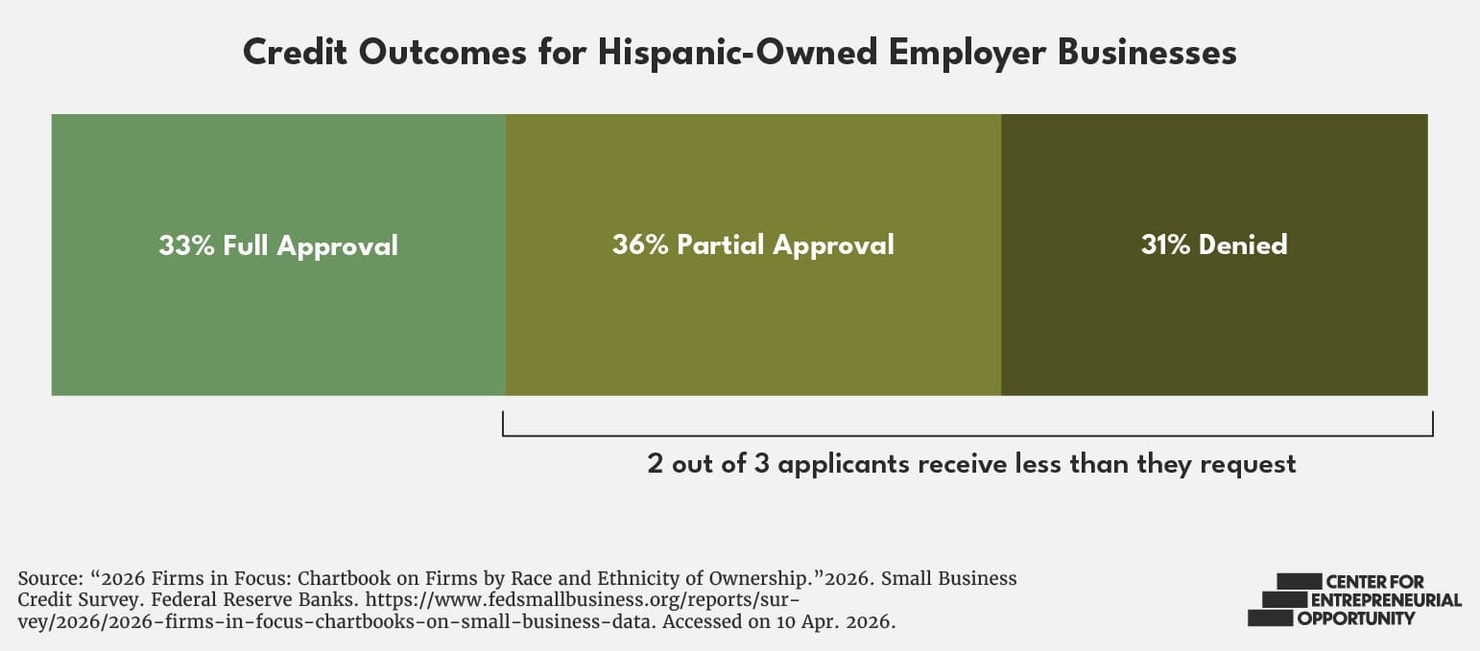
Hispanic-owned businesses face a lending gap. They are less likely to receive the financing they seek and more likely to be denied credit, despite being more likely to request smaller amounts of financing.
Access to capital is a critical input for business growth and scaling—helping firms hire employees, purchase equipment, expand operations, and enter new markets. Yet Hispanic-owned businesses report significantly worse financing outcomes than White-owned businesses. Among businesses that sought a loan or line of credit, just 33% of Hispanic-owned firms received full approval, compared to 57% of White-owned firms.16 Meanwhile, one-third of Hispanic-owned firms were denied financing altogether.17
Hispanic-owned businesses were also twice as likely as White-owned businesses to receive financing from family or friends, underscoring the extent to which Hispanic entrepreneurs rely on personal networks when traditional credit is harder to access.18
A new SBA rule barring foreign nationals from small business financing is likely to hit Hispanic-owned firms especially hard, given how many are connected to immigrant communities. During FY 2025, Hispanic-owned businesses accounted for 11% of all 7(a) loans issued, amounting to $2.8 billion in funding.19 Cutting back programs like 7(a) would strip away a vital funding source, tightening the financial squeeze on Hispanic entrepreneurs even further.
Together, these findings suggest that Hispanic entrepreneurs often face greater obstacles accessing the capital needed to grow, hire, and scale their businesses.
Pathways to Scaling
Finding 9: Adopting New Technologies
Hispanic-owned businesses are embracing new technologies at a rapid pace. Hispanic business owners are more than twice as likely as White business owners to report fully integrating AI into their operations, while an additional 42% report partial integration.20
Hispanic-owned firms most commonly use AI for marketing, writing, and productivity, with 82% reporting AI use for marketing or content creation. More broadly, 76% of Hispanic-owned businesses using AI report that it is somewhat or very important to producing their core goods and services.21
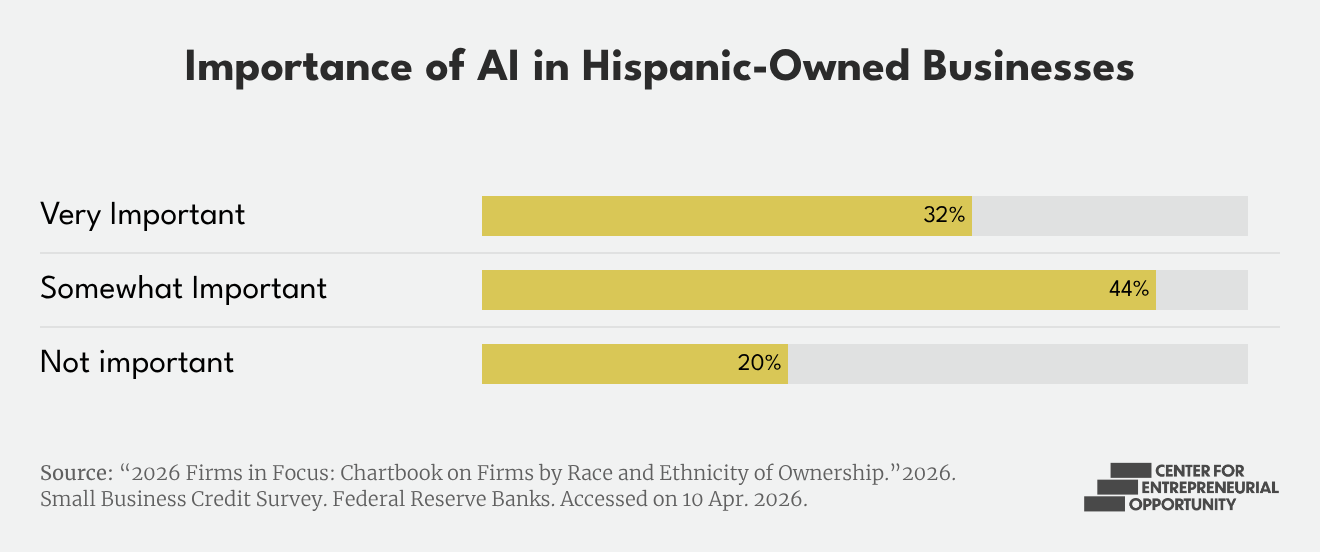
As Hispanic entrepreneurs navigate persistent barriers to capital and business growth, the adoption of AI and other digital tools may provide a way to increase productivity, reach customers, and compete more effectively.
Finding 10: Seeing the Export Advantage
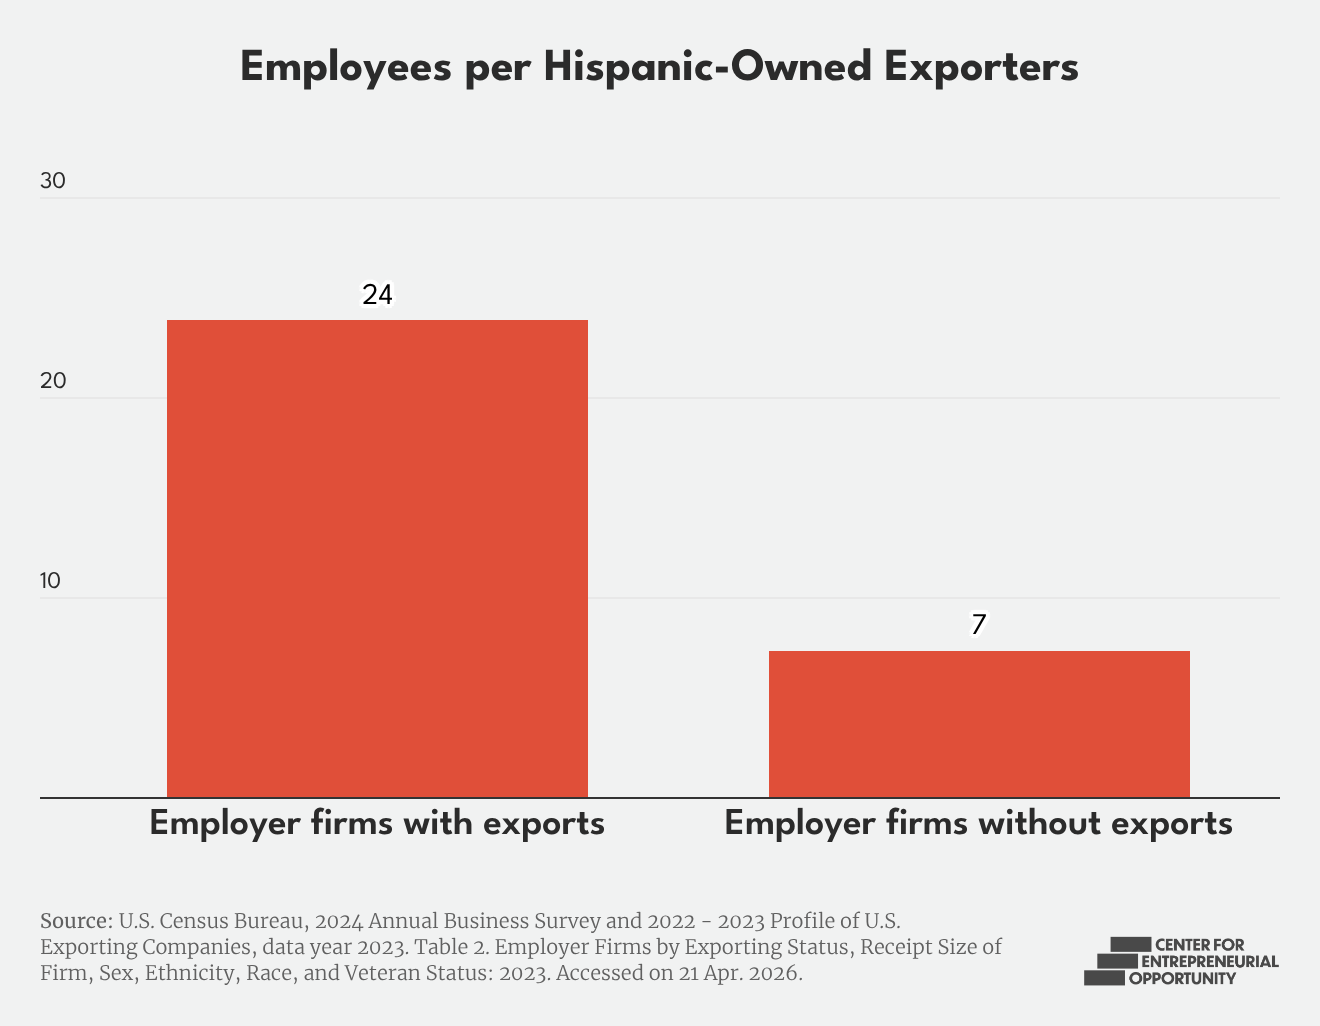
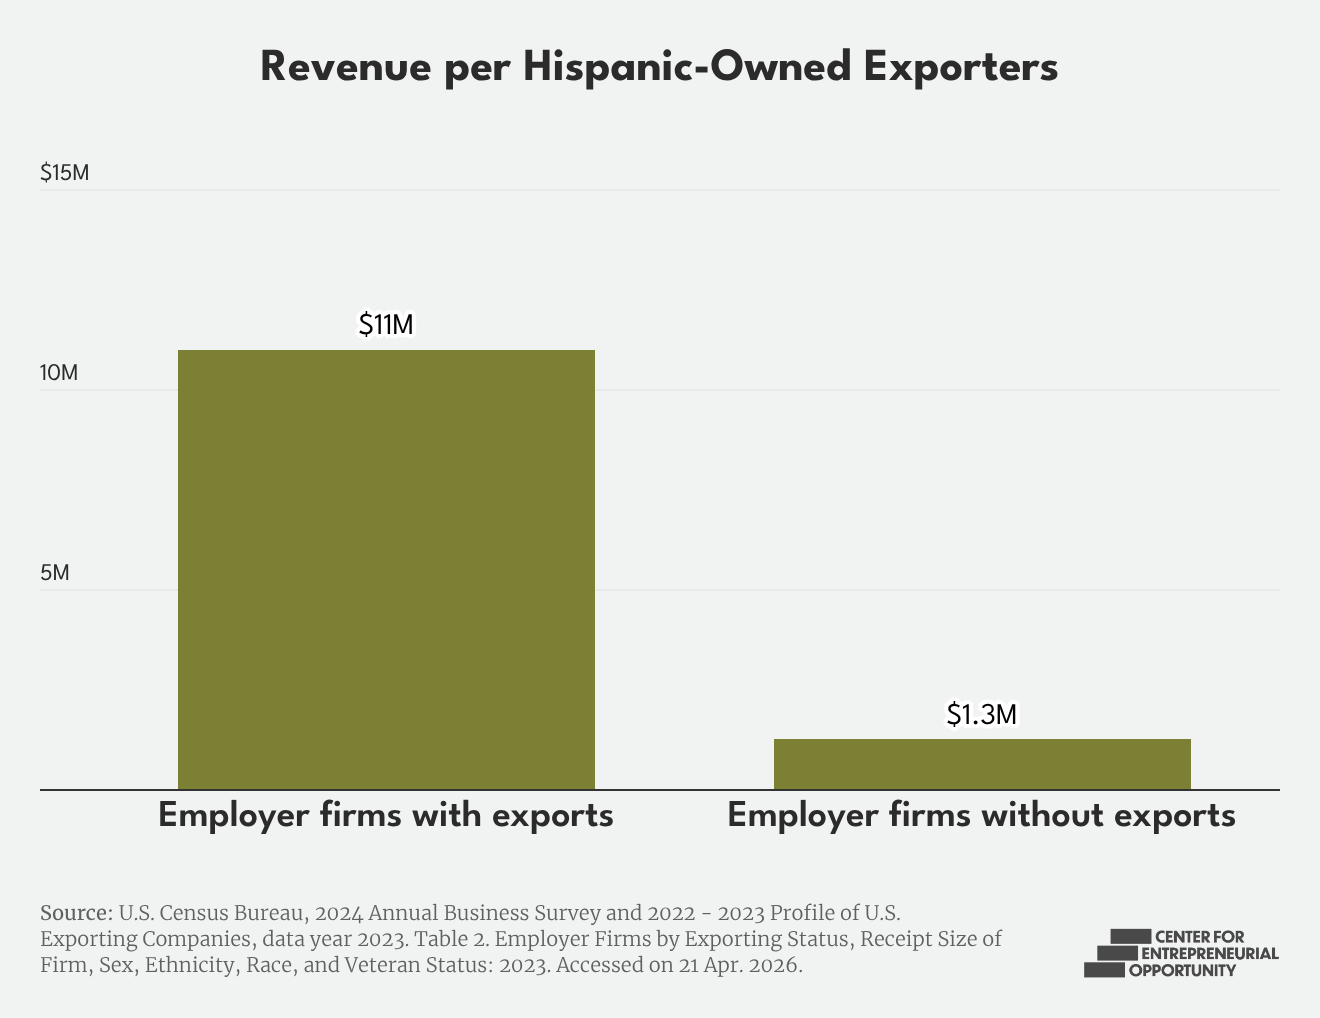
Although only 2.1% of Hispanic-owned employer firms are exporters, they account for 16% of all revenue generated by Hispanic-owned employer firms.22 Hispanic-owned exporters punch well above their weight, generating a disproportionate share of economic activity. For exporters, international sales account for roughly one out of every five dollars in revenue.23
Hispanic-owned exporters employ more workers, generate more revenue, and operate at a larger scale than non-exporters.24 Although exporting can help firms reach new customers and markets, exporters also tend to be businesses that have already overcome many of the barriers to growth.
Moving from Growth to Scale
Hispanic entrepreneurship is one of the strongest growth stories of the last decade—yet as this report shows, growth in the number of businesses has not translated into growth in business scale.
Hispanic entrepreneurs are more likely to operate non-employer businesses, more likely to be concentrated in industries with lower barriers to entry, and less likely to scale in sectors where capital, credentials, and market access play a critical role. Together, these patterns point to a broader Hispanic business scaling gap—one defined not by a lack of entrepreneurial activity, but by structural barriers that limit the ability of firms to grow, hire, and fully participate in higher-value segments of the economy.
Closing that scaling gap represents one of the largest opportunities to expand business ownership, job creation, and wealth formation in Hispanic communities—but the gap will not close itself. The data in this report point to a clear set of policy levers: expanding access to capital, addressing barriers to entry in professional and financial services industries, and supporting the scaling of firms in sectors where Hispanic entrepreneurs already have a foothold.
The challenge is not a lack of entrepreneurial ambition—the data show Hispanic entrepreneurs are starting businesses at remarkable rates. The challenge is ensuring more of those businesses can grow.